

A vast amount of savings needs to be reviewed to save losses from over cautious decision making or just plain inertia.
Cash ISA savers don’t like risk and they probably:
- don’t switch ISA providers very often.
- don’t realise that loyalty to their ISA provider means they’ll be getting lower rates than new investors.
- couldn’t tell you the rate they are getting currently.
- don’t understand how inflation affects their returns.
Despite this, they’ll probably top-up their cash ISA before April 5th, to make use of their tax free allowances.
The current allowance of £15,240 is too high for many people, but even savers sticking to the 1999 launch maximum of £3,000, will have over £50,000 squirrelled away in risk free cash ISAs.
For some, this is cash that will probably never be spent and will flow down to their kids.
Others however, need to understand the ongoing real-terms loss they are making and consider whether to “invest” rather than “save” some of their money.
Cash ISAs used to work quite well
In April 1999, the landscape for a cash ISA was very attractive:
- Average ISA Savings Rate 6.32%
- Inflation (RPI) 1.60%
- Tax Free Real Returns 4.65%
However, as we move into 2017, the landscape is very different:
- Average ISA Savings Rate 0.46%
- Inflation (RPI) 2.50%
- Tax Free Real Returns -1.99%
Every client will understand that rates have fallen in recent years, but very few realise just how low their rates are currently.
This chart illustrates how long they have been losing in real terms.
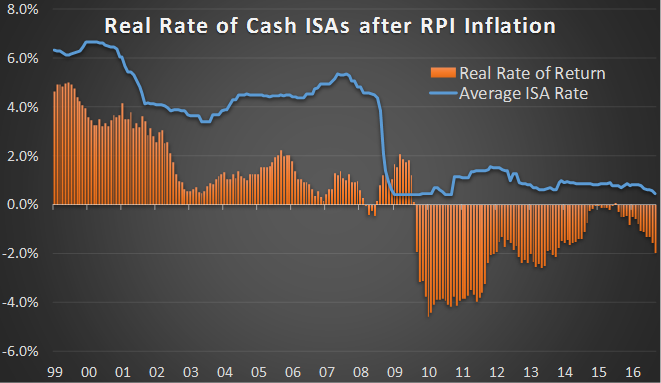
Data source and chart: O&M Systems – they provide excellent tools that we use for cash flow and aid financial planning
This article does not constitute advice and you should take professional advice when investing.